


TL;DR:
- Geographic and biochemical origin produce measurable and reproducible differences in aroma profiles, enabling accurate classification and prediction. Environmental, genetic, and processing factors influence volatile compound ratios, which persist through roasting and processing, reflecting origin-specific signatures. Analyzing these signatures with chemometric models supports origin verification, traceability, and authenticity across commodities like coffee, wine, spices, and citrus oils.
Geographic and biochemical origin reliably changes aroma chemistry and perception because environmental, genetic, and processing factors alter volatile synthesis and compound ratios in ways that are reproducible, measurable, and classifiable. This is not a soft claim. Explainable AI applied to volatile profiles achieves SVM classification accuracy of 91% across coffee origins, with Ridge Regression predicting sensory intensity at R² = 0.88, RMSE = 0.38. Origin is a tractable analytical variable, not a marketing abstraction.
What origin-driven aroma differences look like in practice:
- Terpenes, esters, lactones, pyrazines, and norisoprenoids are the volatile families that most consistently encode regional signals
- GC-MS combined with HS-SPME and chemometrics (PCA, PLS-DA, SVM) is the standard pipeline for detecting those signals
- Origin effects survive processing to a degree: precursor molecules inherited from the plant persist as molecular signatures even after roasting
- Postharvest processing, fermentation, and storage can mask or overwrite origin signals, so metadata control is non-negotiable
- Sensory validation via trained panels and odor activity values (OAV) is required to confirm that chemical differences translate to perceptible aroma differences
For researchers, the immediate implication is this: origin is a factor you can model, but only if you separate geographic, genetic, and processing variables in your study design from the start.
Table of Contents
- How researchers define ‘origin’ in aroma studies
- Which chemical classes encode origin signals?
- How genotype and environment control volatile synthesis
- What analytical pipeline links origin to aroma?
- How chemical differences map to human perception
- Commodity examples where origin drives aroma
- When origin signals vanish: processing, storage, and adulteration
- Practical uses: traceability, quality grading, and product development
- A practical protocol for researchers investigating origin effects
- Recent research highlights and open questions
- Key Takeaways
- Why origin science matters more than most industry teams realize
- Annotated bibliography of recommended primary sources
- Qahwat Al’Ard: single-origin coffee with traceable aroma provenance
- FAQ
How researchers define ‘origin’ in aroma studies
“Origin” in aroma research is not a single variable. It is a composite of at least five separable factors, and conflating them is the most common design flaw in the field.
Geographic variables include soil chemistry (pH, mineral content, organic matter), altitude, aspect, and the local climate regime (temperature range, precipitation, solar radiation). These shape precursor availability and enzyme expression in the plant. Terroir is the term borrowed from viticulture for the confluence of all environmental factors plus human agricultural practice at a specific site. It is useful shorthand but imprecise for experimental design because it bundles geography with agronomic decisions.
Genotype and cultivar are distinct from geography. Two cultivars grown at the same site can produce substantially different volatile profiles, just as the same cultivar grown at different altitudes can. Altitude effects on coffee flavor illustrate this clearly: higher-altitude beans develop more slowly, accumulating different sugar and acid precursors that feed into aroma formation during roasting.
Agronomic practice (fertilization, irrigation, shade management, harvest timing) and postharvest processing (wet vs. dry fermentation, drying method, storage conditions) are human-driven factors that can amplify or suppress the geographic signal. Harvest timing alone shifts the ratio of green to ripe fruit, changing the substrate available for both enzymatic and Maillard-driven volatile formation.
Treating ‘origin’ as a single independent variable without specifying which subcomponent you are testing is the fastest way to produce uninterpretable results. A study comparing Ethiopian and Colombian coffees is simultaneously comparing geography, cultivar, altitude, and processing unless those variables are explicitly controlled or stratified.
Scale matters too. Farm plot, microregion, and country represent three different levels of origin signal. Country-level comparisons capture broad climatic and genetic differences. Microregion comparisons (e.g., specific zones within Minas Gerais, Brazil) can reveal finer-grained sensory maps tied to soil type and altitude bands. Farm-plot comparisons are most useful for precision traceability but require the largest sample sizes to achieve statistical power.
Metadata to collect at minimum: GPS coordinates, elevation, soil type and pH, cultivar or variety name, harvest date and ripeness assessment, fermentation protocol (duration, temperature, inoculant or spontaneous), drying method and duration, storage temperature and humidity, and roast profile if applicable. Missing any of these makes it impossible to disentangle origin from confounders in the analysis.

Which chemical classes encode origin signals?
Not all volatile families are equally useful as origin markers. The key distinction is between compounds whose biosynthesis is tightly coupled to plant metabolism (and therefore to genotype and environment) versus those generated primarily during fermentation or thermal processing.

Terpenes and monoterpenes (linalool, limonene, α-terpineol, geraniol) are synthesized via the MEP and MVA pathways in plant tissue. Their abundance responds to temperature, solar radiation, and soil nutrient status, making them strong geographic markers. Linalool and linalool oxide carry floral and woody notes; limonene drives citrus character. In wine, higher terpenes and norisoprenoids appear in eastern producing areas with greater solar radiation and diurnal temperature range.
Norisoprenoids (β-damascenone, β-ionone) derive from carotenoid degradation and contribute fruity, tea-like, and rose-like notes. They are particularly sensitive to light exposure and temperature during ripening, so regional climate patterns leave a clear signature in their abundance.
Esters (ethyl acetate, isoamyl acetate, ethyl hexanoate) are partly plant-derived and partly fermentation-derived. This dual origin makes them useful markers but requires careful interpretation: an elevated ester profile could reflect regional fruit character or a specific fermentation protocol.
Lactones (γ-nonalactone, δ-decalactone) arise from fatty acid oxidation and contribute creamy, peach-like, and coconut notes. In the Chinese wine study, lactones and furanones were higher in western producing areas linked to higher precipitation, suggesting a climate-to-lipid-oxidation pathway.
Pyrazines and pyrroles are primarily Maillard reaction products formed during roasting or cooking, so they carry less geographic information in raw materials but dominate roasted coffee profiles. Certain alkylpyrazines do show origin-linked precursor differences that survive roasting.
Sulfur compounds (methanethiol, dimethyl sulfide) contribute pungency and savory notes. They are highly potent at low concentrations and often origin-linked in alliums, brassicas, and some spice crops.
Phenolics (guaiacol, eugenol, 4-vinylguaiacol) reflect both plant phenolic metabolism and thermal degradation of lignin. In coffee, their ratios are influenced by both origin and roast degree.
A critical structural point: most volatile compounds are shared across origins as a core chemical fingerprint. The discriminating power comes from a smaller subset showing differential abundance patterns. In the Vietnamese black pepper study, 117 volatile compounds were identified, with 106 shared across all regions as a core fingerprint, while regional differentiation was driven by a subset of those compounds. This core-plus-discriminating-subset architecture is consistent across commodities and has direct implications for feature selection in chemometric models.
Pro Tip: When building a targeted volatile panel for origin classification, do not include all detected compounds. Use VIP scores from PLS-DA or SHAP values from SVM models to identify the discriminating subset. Including the full core fingerprint adds noise and reduces classification accuracy.
How genotype and environment control volatile synthesis
The pathway from geography to aroma compound is biochemical, and understanding it helps researchers predict which compound families to target and why environmental metadata matters.
Terpene biosynthesis runs through two parallel routes in plant cells: the methylerythritol phosphate (MEP) pathway in plastids, producing monoterpenes and diterpenes, and the mevalonate (MVA) pathway in the cytosol, producing sesquiterpenes and triterpenes. Both pathways are sensitive to temperature and light. High solar radiation upregulates MEP pathway flux in many species, which is why high-altitude and high-radiation growing regions often show elevated monoterpene concentrations. Soil nitrogen and phosphorus availability also modulate terpene synthase expression.
Amino acid catabolism feeds into pyrazines (via the Strecker degradation of amino acids during Maillard reactions) and into some esters and aldehydes through transamination and decarboxylation. The amino acid profile of the raw material is shaped by soil nitrogen, plant stress responses, and ripening stage, all of which are origin-linked.
Fatty acid degradation through lipoxygenase pathways produces lactones, aldehydes (hexanal, nonanal), and alcohols. The lipid composition of plant tissue varies with temperature during development: cooler growing conditions tend to increase unsaturated fatty acid content, which shifts the downstream volatile profile toward specific lactone and aldehyde patterns.
Maillard precursors (reducing sugars and free amino acids) accumulate during ripening and are strongly influenced by harvest timing and climate. Their concentration at harvest determines the potential for pyrazine and furan formation during roasting or cooking. This is why origin differences in green coffee can persist as detectable signatures in roasted coffee: the precursor pool is origin-stamped before any thermal processing begins.
Microbial terroir deserves more attention than it typically receives in origin studies. Indigenous yeast communities on fruit surfaces and in fermentation environments produce fermentation-derived esters and alcohols that are regionally distinctive. Research on Shangri-La wines found that distinct volatile compositions linked to indigenous yeasts were key contributors to regional aroma profiles, separate from the grape variety or climate effects.
Environmental drivers in summary: temperature fluctuations during ripening modulate terpene synthase activity; solar radiation drives carotenoid accumulation (norisoprenoid precursors); precipitation affects lipid oxidation rates and fungal/microbial load; soil mineral content influences enzyme cofactor availability. Each of these is measurable and should be recorded as study metadata.
Pro Tip: For studies comparing growing regions, collect meteorological data (mean temperature, diurnal range, total solar radiation, precipitation) for the 60-day pre-harvest window. This is the period when most aroma precursors accumulate, and it gives you the environmental covariates needed to build regression models linking climate to volatile abundance.
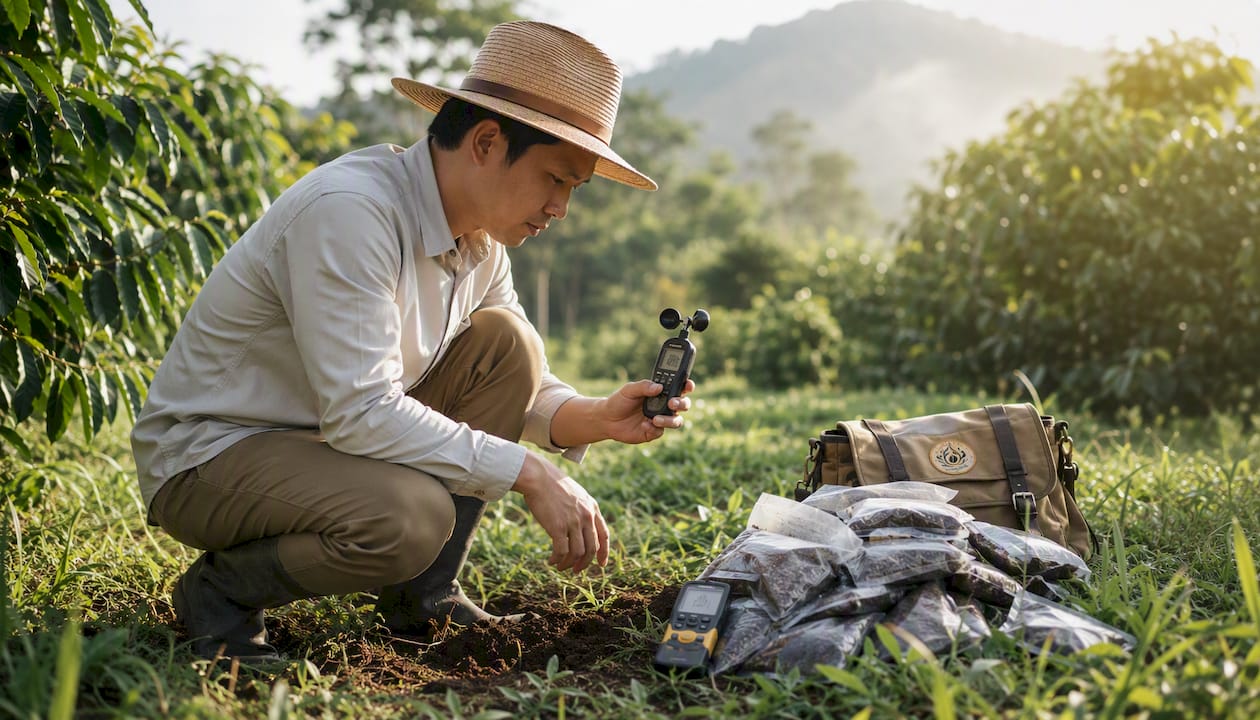
What analytical pipeline links origin to aroma?
A well-designed origin-aroma study follows a sequential pipeline. Skipping or shortcutting any step introduces confounders that chemometrics cannot fix after the fact.
-
Sampling design and replication. Define the origin scale (farm, microregion, country), stratify by cultivar and processing method where possible, and calculate sample size using power analysis. For SVM classification studies, a minimum of 15–20 samples per class is a practical floor; more is always better. Randomize collection order and include blind duplicates for analytical QC.
-
Sample preparation. Headspace solid-phase microextraction (HS-SPME) is the dominant extraction method for volatile profiling because it is solvent-free, sensitive, and reproducible. Fiber choice matters: DVB/CAR/PDMS fibers cover a broad polarity range and are appropriate for most food matrices. Add an internal standard (deuterated compounds such as d5-2-methyl-1-butanol or d3-linalool are common choices) before extraction to correct for instrument drift and matrix effects.
-
GC-MS analysis. Use a polar column (e.g., DB-Wax) for oxygenated volatiles and a non-polar column (DB-5) for terpenes and hydrocarbons when comprehensive profiling is needed. Report retention indices alongside mass spectra for compound identification. GC-Olfactometry (GC-O) adds a human detector to the separation: a trained assessor sniffs the GC effluent and marks odor-active zones, which are then cross-referenced with MS identification. GC-O is essential when you need to confirm that a chemically detected compound is actually perceptible.
-
Data preprocessing. Deconvolve overlapping peaks using AMDIS or MZmine. Align retention times across runs using a reference standard mix. Normalize peak areas to the internal standard and to sample mass. Log-transform or Pareto-scale before multivariate analysis to reduce the influence of high-abundance compounds on the model.
-
Chemometrics. PCA for exploratory visualization of group separation. PLS-DA for supervised classification with VIP scores to identify discriminating compounds. SVM for high-accuracy classification, particularly when class boundaries are non-linear. Ridge Regression (or PLS regression) for predicting continuous sensory scores from volatile data. The explainable AI coffee study used SVM for classification (91% accuracy) and Ridge Regression for sensory intensity prediction (R² = 0.88), with SHAP values to identify which volatiles drove each prediction.
-
Validation. Never report training accuracy as model performance. Use k-fold cross-validation (k = 5 or 10) for internal validation and an external holdout set (at minimum 20% of samples, collected independently) for unbiased performance estimates. Run permutation tests to confirm that classification accuracy exceeds chance. Report confusion matrices, precision, recall, F1, R², RMSE, and effect sizes.
-
Interpretability. SHAP (SHapley Additive exPlanations) values assign each volatile a contribution score for each prediction, making the model auditable. VIP scores from PLS-DA serve a similar function. Both tools help you move from “the model works” to “these specific compounds drive the origin signal,” which is what authenticity and traceability applications require.
Pro Tip: Use nested cross-validation when tuning SVM hyperparameters: an outer loop for performance estimation and an inner loop for hyperparameter selection. Tuning and evaluating on the same fold inflates accuracy estimates by 5–15 percentage points in typical food chemistry datasets.
A study of 99 red wine samples across regions used HS-SPME/GC-MS coupled with chemometrics and found that region was a primary driver of volatile composition, more important than grape variety, with 54 key volatiles identified as regional markers. That finding has direct methodological implications: if you are studying wine origin, controlling for variety is important but may matter less than controlling for region.
How chemical differences map to human perception
Measuring volatiles is necessary but not sufficient. A compound present at high concentration may be below its odor detection threshold, while a trace compound with a very low threshold can dominate perception. The link between chemistry and perception requires dedicated sensory methodology.
Odor Activity Values (OAV) are the ratio of a compound’s concentration to its detection threshold. An OAV above 1 indicates the compound is likely perceptible; compounds with OAV > 10 are typically major contributors to overall aroma character. Calculating OAVs for your compound list is the fastest way to identify which volatiles are analytically abundant versus which ones actually matter to the nose.
GC-Olfactometry goes further by having trained assessors directly evaluate the odor character of GC-separated fractions. Frequency-of-detection methods (CHARM, AEDA) rank compounds by how consistently panelists detect them, producing a ranked list of odor-active compounds that can be cross-referenced with MS identification.
Descriptive analysis panels use 8–15 trained assessors who evaluate samples against defined reference standards on anchored intensity scales. The output is a quantitative sensory profile that can be correlated with volatile data via regression. The Vietnamese black pepper study achieved an RV coefficient of 0.88 between GC-MS profiles and sensory panel data, confirming that the chemical regional fingerprint maps directly to perceptible sensory differences.
Perception depends more on mixture interactions than on any single compound’s concentration. A low-threshold “top note” can dominate the perceived aroma even when present at a fraction of the concentration of other volatiles. This is why OAV-ranked compound lists are more predictive of sensory character than raw peak area rankings.
Cultural and biological moderators are real but often overstated. Research involving 225 individuals from nine diverse non-Western cultures, from hunter-gatherer to urban societies, found that physicochemical structure of odorants explains most variance in pleasantness ratings, with culture not emerging as a major predictor. Individual biology (receptor polymorphisms, age, health status) and early-life exposure shape detection thresholds and preferences, but the molecular properties of the odorant remain the dominant driver of hedonic response across populations.
Human olfactory sensitivity also shows plasticity tied to environmental exposure: people who regularly encounter specific odorants in their daily environment tend to develop lower detection thresholds for those compounds. This has a practical implication for sensory panel design. Locale-specific panels may detect regional top notes that panels recruited from a different geographic context miss entirely.
Sensory design checklist:
- Select and train panelists using threshold and recognition tests before the study begins
- Use randomized, balanced presentation order with three-digit blind codes
- Include reference standards for each descriptor to anchor scale use across sessions
- Replicate each sample at least twice across sessions to estimate within-panelist variance
- Analyze data with ANOVA (mixed models to account for panelist as a random effect) and multivariate correlation with chemical data
- Report effect sizes alongside p-values; statistical significance with tiny effect sizes is not scientifically meaningful
Commodity examples where origin drives aroma
The evidence for origin-driven aroma differences is strongest in commodities with long research histories and well-characterized volatile profiles. The following examples illustrate how the chemistry, methods, and sensory outcomes connect.
Coffee
Coffee is the most analytically studied commodity for origin-aroma relationships. VOC fingerprinting combined with network analysis shows that origin-linked precursors persist as molecular signatures even after roasting, enabling traceability through the supply chain. Within Brazil’s Minas Gerais state, specific microregions consistently correlate with lipid-linked body markers and sugar-derived floral and honey notes, creating a sensory map that buyers and authenticity systems can use. The explainable AI study pushed classification accuracy to 91% using SVM on volatile profiles, with SHAP values identifying the specific volatiles that drove each origin prediction.
Wine and grapes
In a study of 99 red wine samples, region was a primary driver of volatile composition, outweighing grape variety as a differentiating factor. Fifty-four key volatiles were identified as regional markers. Climate variables (precipitation, photosynthetically active radiation, diurnal temperature range) correlated with specific volatile groups: terpenes and norisoprenoids were higher in eastern areas with greater solar radiation, while lactones and furanones were elevated in western areas with higher precipitation. Spontaneous fermentation adds another layer: indigenous yeast communities in Shangri-La sub-regions produced distinct ester and alcohol profiles that contributed to regional aroma character beyond what climate alone could explain.
Black pepper and spices
The Vietnamese black pepper study is a methodological benchmark for spice origin research. Researchers identified 117 volatile compounds across growing regions, with 106 forming a shared core fingerprint and a discriminating subset driving regional differentiation. The RV coefficient of 0.88 between GC-MS and sensory data is among the highest reported for any food commodity, confirming that chemical regional differences in black pepper translate directly to perceptible sensory differences. Sensory scientists working on this study noted that region-specific top notes (bright, high-volatility compounds) were the most reliable authenticity signals, with their absence suggesting freshness or processing problems.
Essential oils and citrus
| Commodity | Key volatile markers | Primary environmental driver | Chemometric result |
|---|---|---|---|
| Coffee (Arabica) | Pyrazines, furans, linalool, esters | Altitude, soil, cultivar | SVM 91% accuracy |
| Red wine | Terpenes, norisoprenoids, esters, lactones | Solar radiation, precipitation, diurnal range | 54 regional markers identified |
| Black pepper | Monoterpenes, sesquiterpenes, phenylpropanoids | Soil, microclimate, harvest timing | RV = 0.88 (sensory-chemical) |
| Citrus essential oils | Limonene, linalool, β-pinene, myrcene | Soil mineral content, altitude, climate | Terpene ratio shifts by region |
In citrus essential oils, limonene dominates the profile (often above 90% of total volatiles) but the minor terpene fraction (linalool, β-pinene, myrcene, sabinene) carries the regional signature. Altitude and soil mineral content alter the minor terpene ratios in ways that are detectable by GC-MS and meaningful for authentication of geographic indication (GI) products.
- Raw material origin affects aroma compound release during consumption, not just composition at harvest
- Starch matrix origin, for example, alters how volatiles are liberated during processing, a cross-commodity principle with implications for ingredient sourcing
When origin signals vanish: processing, storage, and adulteration
Origin signals are real, but they are not indestructible. Several processes can mask, overwrite, or mimic them, and researchers who do not account for these confounders will misattribute processing effects to geography.
Roasting and thermal processing are the most powerful confounders. Maillard reaction products (pyrazines, furans, furanones) generated during roasting dominate the volatile profile of roasted coffee, partially obscuring the origin signal. However, the precursor pool inherited from the green bean is origin-stamped, so the ratio and type of Maillard products formed still carry geographic information. The key is that you cannot compare roasted samples from different origins without controlling for roast degree: a darker roast from one origin will look more similar to a dark roast from another origin than to a light roast from the same origin.
Fermentation introduces yeast and bacterial metabolites (esters, higher alcohols, acetic acid) that can swamp plant-derived volatiles. Spontaneous fermentation using indigenous microbes can actually reinforce regional character (as in the Shangri-La wine example), but controlled inoculation with commercial yeast strains tends to homogenize profiles across origins.
Blending is a deliberate origin-masking strategy. A blend like the Max Caf Blend combines beans from multiple origins to achieve a consistent flavor target, which by design reduces the discriminating volatile subset that origin classification models rely on. This is commercially useful but means that multivariate models trained on single-origin samples will not classify blends correctly.
Prolonged storage drives oxidation of terpenes and unsaturated fatty acid derivatives, degrading the fresh top notes that carry the most origin-specific information. Monoterpenes are particularly vulnerable: limonene oxidizes to carvone and other products within weeks at ambient temperature. Storage conditions (temperature, oxygen exposure, light) must be recorded and standardized across samples in any origin study.
Adulteration and reconstitution present a different problem: a fraudulent product may be designed to mimic the volatile profile of a high-value origin. Multivariate authenticity models need to be trained on verified authentic samples and validated against known adulterants, not just against other authentic origins.
Pro Tip: Always include a processing metadata log as a required variable in your study design. Record fermentation duration and temperature, drying method, roast profile (time-temperature curve), and storage duration and conditions for every sample. Without this, you cannot separate origin effects from processing effects in your statistical model, and reviewers will ask.
Experimental controls to implement:
- Collect samples at the same processing stage across all origins (e.g., all green unroasted, or all roasted to the same degree measured by colorimetry)
- Include blind analytical replicates (same sample extracted twice) to estimate extraction variability
- Record and report the full provenance chain from harvest to analysis
- For authenticity studies, include known-adulterant samples in the training set and report sensitivity and specificity separately from overall accuracy
Practical uses: traceability, quality grading, and product development
The scientific case for origin-driven aroma differences has direct commercial and regulatory applications. The gap between the research and the product shelf is smaller than most industry teams realize.
Authenticity and traceability systems use volatile fingerprints as molecular passports. A product claiming single-origin status can be verified against a reference database of authentic samples from that origin using the same SVM or PLS-DA models developed for research. The VOC fingerprinting approach for Arabica coffees demonstrates that origin-linked markers persist through roasting, making post-roast authentication feasible.
Geographic indication (GI) support is one of the most commercially significant applications. GI systems (Protected Designation of Origin in the EU, equivalent frameworks in the US and internationally) require demonstrable links between a geographic area and product characteristics. Reproducible GC-MS methods with validated chemometric models provide exactly the kind of analytical evidence that GI applications and enforcement actions require.
Sensory-driven quality grading uses the same volatile-sensory correlation models to predict cup quality scores from chemical data, reducing the cost and variability of human cupping panels for routine quality control. The Ridge Regression model achieving R² = 0.88 for sensory intensity prediction means that a substantial proportion of panel score variance can be explained by volatile composition alone.
Single-origin product launches grounded in analytical evidence are more defensible than those based on marketing narrative alone. When a product label claims a specific origin, the volatile fingerprint of that product should match the reference database for that origin. This is not just good science; it is protection against fraud claims and a foundation for premium pricing.
Pro Tip: Build your reference database before launching origin-specific products. Collect and analyze at least three harvest years of authenticated samples from each claimed origin, and update the database annually. A single-year reference set is vulnerable to vintage effects and will generate false negatives in authentication checks.
Qahwat Al’Ard’s single-origin collection and products like Peru Coffee Pods represent exactly the kind of traceable, origin-specific SKUs where volatile fingerprinting adds commercial value. The analytical evidence for origin-driven aroma differences supports the premium positioning of these products and provides a framework for third-party verification of origin claims.
Practical adoption checklist for commercial teams:
- Establish an analytical baseline: GC-MS volatile profiles for each claimed origin, collected across at least two harvest years
- Validate with a trained sensory panel using descriptive analysis against defined reference standards
- Document the full traceability chain: GPS, cultivar, harvest date, processing method, storage conditions
- Align consumer messaging with the specific aroma characteristics supported by the analytical data (e.g., “floral and citrus notes linked to high-altitude terpene expression” rather than generic “complex flavor”)
A practical protocol for researchers investigating origin effects
Reproducibility in origin-aroma research is poor relative to other food science fields, largely because of inconsistent sampling, underpowered designs, and inadequate metadata reporting. The following protocol addresses the most common failure points.
-
Define hypothesis and origin scale. State explicitly whether you are testing country-level, regional, or farm-level origin effects, and which subcomponent of origin (geography, cultivar, processing) is the primary variable. Pre-register the hypothesis and analysis plan.
-
Sampling strategy and sample size justification. Conduct a power analysis using effect sizes from published studies in the same commodity. For classification studies, target at least 15–20 samples per class; for regression, follow standard power analysis for the number of predictors. Stratify sampling to balance cultivar and processing method across origin groups.
-
Standardized sample preparation. Use HS-SPME with a documented fiber type, extraction temperature, and time. Add a deuterated internal standard before extraction. Prepare all samples in randomized order within a single analytical batch where possible, or use batch correction if multiple batches are unavoidable.
-
Instrumental parameters and QA/QC. Run a standard mix at the start and end of each analytical session to monitor instrument performance. Report retention indices for all identified compounds. Include method blanks and matrix spikes to detect contamination and assess recovery.
-
Sensory protocol design. Train panelists to criterion before data collection. Use randomized, balanced presentation with reference standards for each descriptor. Replicate each sample at least twice across sessions. Collect data in a controlled environment (temperature, humidity, no competing odors).
-
Data preprocessing and chemometrics plan. Document all preprocessing steps (deconvolution software, alignment algorithm, normalization method, scaling). Specify the chemometric models and their hyperparameters before analysis. Use nested cross-validation for hyperparameter tuning.
-
Validation strategy. Reserve an external holdout set (collected independently from the training set, ideally from a different harvest year) for final model evaluation. Run permutation tests to confirm that accuracy exceeds chance. Report full confusion matrices and uncertainty estimates.
-
Reporting standards. Deposit raw data and processing scripts in a public repository (Zenodo, Figshare, or a domain-specific repository). Report all metadata variables. Follow FAIR data principles. Consider preregistration on OSF or a domain journal’s registered report track.
Pro Tip: Preregistering your study design and analysis plan before data collection is the single highest-leverage action for improving the credibility of origin-aroma research. It prevents post-hoc model selection (a major source of inflated accuracy in the literature) and signals methodological rigor to reviewers and readers.
Recent research highlights and open questions
The field has moved quickly in the past three years, driven by two convergent developments: the adoption of explainable AI tools that make chemometric models interpretable, and the accumulation of multi-commodity datasets large enough to train high-accuracy classifiers.
The MDPI explainable AI coffee study is the current benchmark for classification performance, achieving SVM accuracy of 91% and Ridge Regression R² = 0.88 for sensory intensity prediction. SHAP values identified the specific volatiles driving each prediction, moving the field beyond black-box classification toward mechanistically interpretable models. This is significant because interpretable models are auditable: a regulatory body or certification organization can examine which compounds the model relies on and verify that they are chemically plausible origin markers.
| Study | Commodity | Method | Key metric |
|---|---|---|---|
| MDPI explainable AI (coffee) | Arabica coffee | SVM + Ridge Regression + SHAP | Classification 91%; R² = 0.88 |
| Frontiers black pepper | Vietnamese black pepper | GC-MS + sensory panel | RV = 0.88 (sensory-chemical) |
| PMC wine volatile study | Red wine (99 samples) | HS-SPME/GC-MS + chemometrics | 54 regional markers; region > variety |
| Scientific Reports (Shangri-La wine) | Cabernet Sauvignon | Spontaneous fermentation + GC-MS | Distinct regional ester/alcohol profiles |
| ResearchGate Minas Gerais coffee | Arabica (Brazil) | Chemical + sensory profiling | Consistent microregion-sensory correlations |
Open research questions where the field has clear gaps:
- Sampling standardization across commodities. There is no agreed protocol for HS-SPME conditions, internal standards, or data preprocessing across food categories. A cross-commodity consensus protocol would dramatically improve comparability of published results.
- Multi-omics integration. Combining genomics (cultivar genotyping), metabolomics (volatile and non-volatile metabolite profiling), and environmental data (climate, soil) into a single analytical framework would allow researchers to partition variance among genetic, environmental, and processing sources with much greater precision than current single-omics approaches.
- Climate change effects on volatile expression. Rising temperatures and shifting precipitation patterns are already altering the precursor pools and enzyme activity windows that determine volatile composition. Longitudinal datasets tracking volatile profiles across harvest years in the same locations are urgently needed to quantify these shifts.
- Scalable authenticity frameworks. Most published models are trained on small, single-study datasets. Building large, multi-laboratory reference databases with standardized methods is the prerequisite for commercially deployable authenticity systems.
Human olfactory plasticity adds another layer of complexity. People who live in specific aroma-rich environments develop lower detection thresholds for the compounds they encounter regularly, which means locale-specific sensory panels may detect origin signals that panels recruited elsewhere miss. This has not been systematically studied in the context of origin-aroma research and represents a methodological gap with practical consequences for sensory validation studies.
Key Takeaways
Geographic and biochemical origin produces reproducible, measurable changes in volatile composition that map to perceptible aroma differences, classifiable at 91% accuracy by SVM and predictable at R² = 0.88 for sensory intensity by Ridge Regression.
| Point | Details |
|---|---|
| Origin is analytically tractable | SVM classification reaches 91% accuracy; Ridge Regression predicts sensory intensity at R² = 0.88 using volatile profiles. |
| Separate origin subcomponents | Geography, cultivar, agronomic practice, and processing must be treated as distinct variables in study design to produce interpretable results. |
| Pair GC-MS with sensory validation | OAV calculations and trained descriptive panels confirm that chemical differences translate to perceptible aroma; RV = 0.88 in black pepper confirms this link. |
| Control processing metadata | Roasting degree, fermentation protocol, and storage conditions must be standardized or recorded; without this, processing effects are indistinguishable from origin effects. |
| Qahwat Al’Ard’s single-origin products | Peru Coffee Pods and the broader single-origin collection represent commercially applied origin traceability, where volatile fingerprinting supports authenticity claims. |
Why origin science matters more than most industry teams realize
The conventional framing in specialty coffee marketing is that origin is a story. A farm name, an altitude, a processing method. That framing is not wrong, but it undersells what the science actually shows.
Origin is a molecular fact. The precursor pool in a green coffee bean is stamped by the soil, the altitude, the microclimate, and the cultivar before any human decision about roasting or packaging enters the picture. When a trained SVM model classifies coffee origins at 91% accuracy from volatile profiles alone, it is not reading marketing copy. It is reading chemistry that the plant encoded during growth.
What the industry tends to underestimate is the durability of that signal. Roasting changes the volatile profile dramatically, but it does not erase origin. The Maillard products formed during roasting are shaped by the precursor pool inherited from the green bean, which means a high-altitude Ethiopian bean and a low-altitude Brazilian bean will produce different pyrazine and furan ratios even at the same roast degree. The origin is still there. It is just expressed differently.
The gap I see most often is between researchers who have the analytical tools to prove origin differences and product teams who are making origin claims without any analytical baseline. A label that says “single-origin Peru” is a testable claim. The volatile fingerprint of that product should match a reference database for Peruvian Arabica. If it does not, you have either a sourcing problem or a labeling problem, and you will not know which without the data.
The researchers reading this have the tools to close that gap. The methods are established, the chemometric frameworks are validated, and the interpretability tools (SHAP, VIP scores) now make the models auditable enough for commercial and regulatory use. What is missing is the will to build the reference databases and preregister the study designs that would make origin claims as verifiable as nutritional labels.
Annotated bibliography of recommended primary sources
The sources below represent the strongest methodological and empirical foundations for origin-aroma research. Each is worth reading in full, not just for its findings but for its methods sections.
The MDPI explainable AI coffee study is the current methodological benchmark for origin classification: it combines SVM (91% accuracy), Ridge Regression (R² = 0.88), and SHAP interpretability in a single pipeline, making it a template for any researcher building an origin-aroma classification system.
Explainable Artificial Intelligence for Coffee Quality Control (MDPI, Foods): Open access. Read Table 2 for the full volatile feature list and Figure 3 for SHAP value visualization. This is the paper to cite when justifying SVM + Ridge Regression as your chemometric approach.
Can you taste the place? Building regional sensory standards for black pepper (Frontiers in Food Science and Technology): Open access. The RV = 0.88 sensory-chemical correlation and the 117-compound volatile inventory make this the best available template for spice origin studies. Inspect the supplementary data for the full compound list and regional abundance patterns.
Characterization of wine volatile compounds from different regions and varieties by HS-SPME/GC-MS coupled with chemometrics (PMC, open access): The 99-sample dataset and 54-compound regional marker list are directly usable as a reference for wine origin studies. The finding that region outweighs variety as a compositional driver is the key result to cite in study rationale sections.
Regional aroma characteristics of spontaneously fermented Cabernet Sauvignon wines from Shangri-La (Scientific Reports, open access): Essential reading for anyone studying fermentation contributions to origin signals. The microbial terroir framing and the ester/alcohol regional profiles are the most useful methodological elements.
Chemical and sensory profile of Coffea arabica L. cultivated in different regions of Minas Gerais (ResearchGate): The microregion-level sensory mapping is the most granular coffee terroir dataset currently available. Use it as a benchmark for within-country origin discrimination studies.
VOC fingerprinting combined with network analysis for Arabica specialty coffees (ResearchGate): The network analysis approach to VOC fingerprinting is methodologically novel and particularly useful for traceability applications where you need to track origin signals through processing stages.
Qahwat Al’Ard: single-origin coffee with traceable aroma provenance
For researchers and product professionals who want to work with verified single-origin material, Qahwat Al’Ard offers a curated collection of traceable, sustainably sourced coffees where origin is the organizing principle, not a marketing afterthought.
The Peru Coffee Pods are a concrete example: a single-origin product where the geographic provenance is specific, the supply chain is documented, and the aroma profile reflects the altitude and soil conditions of the growing region rather than a blended average. For researchers building reference databases or product teams validating origin claims, single-origin SKUs with documented provenance are the right starting material. The single-origin collection also includes 12 Pack Single Serve Coffee Capsules and 60 Pack Single Serve Coffee Pods in origin-specific formats, alongside Instant Coffee options for applications where convenience matters without sacrificing traceability. Browse the full range and use the origin documentation as a starting point for your own analytical baseline.
FAQ
What is the role of origin in aroma?
Origin shapes aroma by determining the volatile precursor pool available in the raw material: geography, cultivar, and growing conditions alter which terpenes, esters, lactones, and pyrazines the plant synthesizes, producing reproducible regional differences in volatile composition that trained sensory panels and GC-MS chemometric models can both detect.
Where does the word “aroma” come from?
The word “aroma” derives from the Greek arōma, meaning spice or sweet herb, which entered Latin and then Middle English to describe fragrant plant substances. Its modern scientific use covers all volatile compounds that stimulate olfactory receptors.
What is aroma derived from in foods?
Food aroma derives from volatile organic compounds produced through biosynthetic pathways in the plant (terpenes, esters, aldehydes), enzymatic reactions during ripening and processing, and thermal reactions (Maillard, caramelization) during cooking or roasting. The relative contribution of each source depends on the commodity and the processing stage.
What is the function of aroma in foods and beverages?
Aroma serves as a primary quality signal, a driver of hedonic response, and an authenticity marker. Chemically, it reflects the metabolic history of the raw material and its processing; perceptually, it accounts for the majority of what consumers describe as “flavor,” since retronasal olfaction dominates taste perception.
How does geographic origin affect fragrance in essential oils?
Soil mineral content, altitude, and climate alter terpene synthase activity and carotenoid accumulation in aromatic plants, shifting the ratio of dominant and minor terpene compounds. In citrus essential oils, for example, the minor terpene fraction (linalool, β-pinene, myrcene) varies by growing region in ways detectable by GC-MS, supporting geographic indication authentication.


